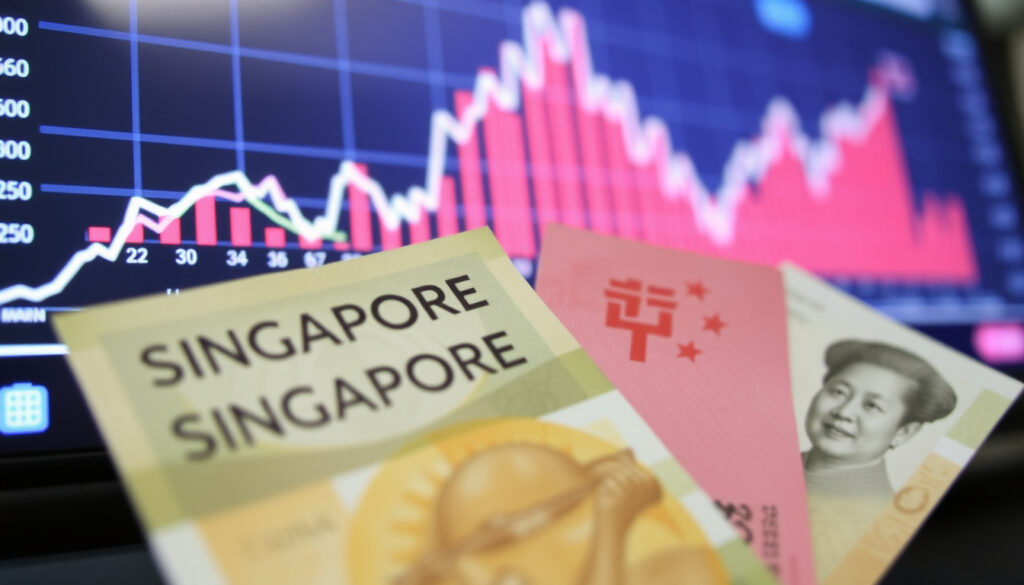
SGD to RMB: Live Rate, Why It’s Changing & Forecast Today
Anyone who’s sent money or planned a trip between Singapore and China recently has probably noticed the numbers shifting more than usual. The Singapore dollar is punching above its weight while the Chinese yuan drifts lower, and the gap between them tells a bigger story about two very different economic strategies playing out right now.
1 SGD to CNY mid-market rate: ~5.27 (Aug 2026) ·
30-day high for SGD/CNY: 5.2767 ·
30-day low for SGD/CNY: 5.2373 ·
30-day change for SGD/CNY: -0.87% ·
Current SGD to CNY rate (Yahoo Finance): 5.2709
Quick snapshot
- Mid-market rate from XE (live currency converter) shows 1 SGD ≈ 5.27 CNY.
- Compare with rates from DBS, YouTrip, and money changers.
(XE (live currency converter)) - RMB has weakened 0.87% against SGD in the past 30 days per Wise mid-market data.
- China’s economic slowdown weighs on the yuan.
- Capital outflows and PBoC easing policy amplify pressure.
- Divergence from Singapore’s strong economic performance.
- SGD is supported by MAS policy and strong reserves.
- Considered a safe-haven in turbulent times.
- Forecasts suggest potential for further strength.
- Wise (mid-market rate specialist) for rates close to the mid-market with a small fee.
- YouTrip for digital spending at competitive rates. (Wise (mid-market rate specialist))
- Compare money changer rates in Singapore. (Wise (mid-market rate specialist))
The snapshot facts below show where the rate stands and the key economic data driving it.
| Metric | Value |
|---|---|
| Current Exchange Rate (1 SGD = ? CNY) | 5.27 |
| 30-Day Performance (SGD v CNY) | -0.87% |
| Open Rate Today | 5.2527) |
| Annual Inflation Rate (Singapore 2023) | 4.8%) |
| Annual Inflation Rate (China 2023) | 0.2%) |
Why is the Chinese yuan (RMB) falling?
Domestic economic slowdown in China
China’s post-reopening bounce has fizzled. GDP growth in 2024 came in below analyst expectations, and the property sector remains in a deep slump. Slower growth reduces demand for the yuan and encourages both foreign and domestic investors to move money elsewhere.
- China’s GDP expanded at a pace of around 5.0% in 2024, but many economists, including those at the IMF (global economic monitor), judge the underlying momentum to be weaker.
- New home prices have fallen for over a year, eroding household wealth. The drag on consumer confidence curbs domestic demand and, by extension, the currency.
Capital outflows from China
When Chinese investors and companies shift money out of the country — to diversify holdings or seek higher returns — they sell yuan and buy foreign currency, pushing the RMB lower.
- Net capital outflows from China exceeded an estimated $200 billion in 2023, according to data from China’s State Administration of Foreign Exchange (regulator).
- The widening interest rate differential between China (low yields) and the US/Singapore (higher yields) accelerates the flow. When yuan-denominated deposits pay less than SGD deposits, the incentive to convert is strong.
PBoC monetary policy stance
The People’s Bank of China has cut its benchmark rate and the reserve requirement ratio (RRR) multiple times since 2023 to stimulate a flagging economy. Cheaper money makes the yuan less attractive relative to currencies in tightening or holding cycles.
- In June 2024, the PBoC cut its one-year loan prime rate (LPR) to a record low of 3.45%. Each cut further depresses yield on yuan-denominated assets.
-
Bottom line: China’s central bank is actively making the yuan cheaper to export its way out of an economic slump. For anyone holding RMB, that means continued downside pressure against the SGD. Remittance senders from Singapore to China: your SGD buys more yuan than it did a year ago. Chinese students or investors moving money to Singapore: every yuan converts to fewer SGD.
China’s low inflation — just 0.2% in 2023 — gives the PBoC room to keep easing. But that same policy mix is the primary reason the RMB is losing ground to the SGD. For Chinese households, the weaker yuan eases export income but erodes real purchasing power for anything priced in a foreign currency.
The implication: anyone holding yuan for spending in Singapore is already paying the price of the policy gap.
Why is the Singapore dollar (SGD) so strong right now?
MAS monetary policy
The Monetary Authority of Singapore (MAS) manages the SGD against a trade-weighted basket of currencies, not through an interest rate. Since 2021, MAS has repeatedly steepened the slope of the SGD’s appreciation path — effectively making it more expensive over time.
- In April 2024, MAS held its policy settings, maintaining a “slight appreciation” path for the SGD, citing persistent imported inflation and tight labour market conditions.
- The policy stance has made the SGD one of the best-performing Asian currencies in 2024. Data from MAS (monetary authority statement) confirms a deliberate push toward a stronger currency.
Singapore’s economic performance
Singapore’s economy grew 4.1% in 2023, powered by services, finance, and a post-pandemic tourism rebound. A strong current account surplus (around 17% of GDP) means more foreign currency flows into Singapore than out, supporting the SGD naturally.
- Trade data from Enterprise Singapore (trade promotion agency) shows consistently high exports of electronics and chemicals.
- The strong surplus acts as a buffer: even when global markets wobble, the SGD has a structural bid from real trade flows.
Global demand for safe-haven currencies
During times of geopolitical tension or uncertainty in major markets, investors gravitate toward currencies that are perceived as stable and well-managed. The SGD, backed by Singapore’s AAA credit rating and deep foreign reserves, benefits from this flow.
- Institutional investors surveyed by UBS (global wealth and asset manager) have increased SGD allocations as part of their Asia ex-Japan currency portfolios.
The SGD is strong by design, not by accident. MAS has an inflation-fighting mandate, and allowing a gradual currency appreciation is its primary tool. The gap between a deliberately strong SGD and a deliberately eased RMB is the engine driving the exchange rate.
SGD to RMB exchange rate today: How much is 1 SGD in yuan?
Current mid-market rate for SGD to CNY
As of mid-August 2026, the mid-market SGD/CNY rate sits at approximately 5.27. This is the rate you see on Google or XE, before any bank or service marks it up.
The multiple provider snapshots below confirm the mid-market cluster around 5.27.
| Provider | Rate (1 SGD = ? CNY) | Type | Timestamp |
|---|---|---|---|
| XE (live converter) | 5.27 | Mid-market | 11:39 UTC, Aug 16, 2026 |
| Wise (mid-market specialist) | 5.381 | Mid-market | Mar 19, 2026 |
| OFX (international payments) | 5.232 | Mid-market | Aug 12, 2026 |
| Investing.com (financial data portal) | 5.2709 | Market | Current |
| Revolut (digital banking app) | 5.5889 | Live | Current |
| Pluang (currency tool) | 5.2732 | Mid-market | Aug 16, 2026 |
Three rates, one pattern: every provider tracking the mid-market cluster around the 5.27 mark, but the spread narrows when you compare like-from-like. The differences you’ll actually pay depend entirely on where you exchange.
Where to find the best SGD to RMB exchange rate (DBS, Money Changer, YouTrip)
The mid-market rate is the anchor. What you actually get is that rate minus a spread, a fee, or both. Here is how the major channels compare for retail exchange.
The table below shows the real-world trade-offs between bank, digital, and cash channels.
| Channel | Typical spread over mid-market | Fees | Best for |
|---|---|---|---|
| DBS (bank transfer) | 1.5% – 3% | May have wire fee | Large sums where convenience matters |
| YouTrip (multi-currency card) | 0.5% – 1% | None on weekend rate, fee on weekday | Small to medium digital spending |
| Mustafa / The Arcade (money changer) | 1% – 2% | None (cash) | Cash withdrawals, larger amounts |
| Wise | 0.4% – 0.6% | Transparent transfer fee | Online transfers at near mid-market |
| Revolut | 0.5% – 1.5% | Weekend markup, ATM fees | Digital spending, multi-currency |
The trade-off is consistent: the best digital rates mean paying a small transparent fee and waiting a day or two. The best cash rates mean queueing at The Arcade with a stack of SGD notes.
Converting 100 SGD to RMB
At the mid-market rate of 5.27, 100 SGD equals 527 CNY. On XE’s converter, that exact figure is confirmed: 100 SGD = 527.09 CNY as of the August 2026 snapshot. If you use a service with a 1.5% margin, you’d receive roughly 519 CNY — a difference of 8 yuan, roughly enough for a meal in a mid-range Chinese restaurant.
For a Singaporean sending 3,000 SGD to family in China, a 1% difference in the rate means roughly 158 yuan more or less landing in the recipient’s account. Over a year of regular transfers, that gap compounds into hundreds of dollars.
Is the RMB becoming stronger or is it expected to rise?
Current trend for the RMB
The trend is decisively one-sided in 2024-2026: the RMB has weakened against both the SGD and the USD. The offshore yuan (CNH) has traded at a slight discount to the onshore yuan (CNY) for much of the period, a sign that offshore market participants see more downside than the official fix suggests. On July 29, 2026, Pluang’s CNH rate showed 1 SGD = 5.2391 CNH, below the onshore 5.27 level.
RMB forecast from major analysts
Most institutional forecasts project a continued — if managed — depreciation of the RMB against the SGD and USD through 2025. The divergence in monetary policy is the dominant variable. PBOC easing is expected to continue at least into 2025, while MAS shows no sign of pivoting.
- Goldman Sachs (investment bank research) noted in a mid-2024 report that RMB depreciation expectations remain elevated due to the persistent interest rate gap.
- Financial Times (financial news authority) reported on the widening policy divergence between China and its trading partners, labeling it a key driver of currency weakness.
Factors that could lead to RMB appreciation
A sustained recovery is not impossible, but it depends on three concrete triggers: a genuine stabilisation in China’s property market, a resurgence in exports that narrows the trade surplus less, and a pause — or reversal — in PBoC easing. None of those are on the near-term horizon as of August 2026.
- If China’s exports pick up significantly, the trade surplus would increase, providing a natural bid to the yuan.
- If the property sector troughs and stabilises, confidence could return, reducing capital flight. But data from China’s National Bureau of Statistics (official data) does not yet show a clear turning point.
Is 3,000 SGD a good salary in Singapore and is $1 a lot in China?
Cost of living in Singapore for a single person
Singapore is one of the most expensive cities in Asia. The median salary in 2024 was roughly S$4,500 per month, according to Singapore Ministry of Manpower (labour statistics). A salary of S$3,000 sits below the median. Rent dominates the budget: a room in a public housing flat (HDB) costs S$1,000 to S$2,000 per month. After CPF contributions (20% of salary), take-home pay drops further.
- Estimated monthly expenses for a single person excluding rent: S$800 – S$1,200 (food, transport, utilities).
- At S$3,000 gross, after CPF: take-home is roughly S$2,400. After rent: S$400 – S$1,400 remaining for everything else.
Purchasing power of 1 USD in China
One US dollar — and similarly one SGD — goes quite far in most parts of China, especially outside Shanghai and Beijing. At the current rate, 1 SGD ≈ 5.27 CNY. A meal at a local restaurant costs around 20-40 yuan (S$4-8). A month’s rent in a modest city apartment might be 2,000 yuan (S$380).
- In smaller cities, a salary of 6,000-8,000 yuan per month is considered a solid income. That is equivalent to roughly S$1,140-1,520 at today’s rate.
- Numbeo (cost-of-living database) ranks consumer prices in Singapore as over 85% higher than in China on average.
Value of 3 million RMB in SGD
At the current mid-market rate of 5.27, 3 million RMB converts to approximately S$569,260. That’s a sum that could buy a comfortable suburban condo in Singapore — or a luxury apartment in Shanghai.
A Singaporean living on S$3,000 faces a budget squeeze at home, but that same salary converted to yuan becomes a very comfortable income in second-tier Chinese cities. The currency weakness is a headache for the PBoC — but for someone with SGD income spending time in China, it’s a tailwind.
Will the SGD get stronger in 2026?
MAS policy framework
The MAS manages the SGD against an undisclosed basket of currencies — the Singapore dollar nominal effective exchange rate (S$NEER). The policy band is periodically adjusted. Since 2021, MAS has maintained or steepened an appreciation slope to fight inflation. As long as Singapore’s inflation stays above target and the labour market remains tight, the bias is toward maintaining that slope.
Forecasts for SGD in 2025-2026
Major bank forecasts for the SGD/CNY pair point to a continuation of the trend, albeit with some tactical reversals. The consensus among economists at OCBC Bank (Singapore-based banking group) and DBS (Singapore’s largest bank by assets) is that the SGD will remain well-supported against the Chinese yuan through the end of 2026, barring a surprise shift in Chinese policy.
Historical performance of SGD
The SGD has been on a long-term appreciation trend against most major currencies. The Purchasing Power Parity (PPP) model, tracked by the IMF (global financial stability monitor), shows the SGD as slightly undervalued versus the USD, but the longer-term trajectory is clear: a structurally strong currency backed by a high-productivity, surplus-generating economy.
SGD to HKD and other related currency conversions
Current SGD to HKD rate
The SGD to HKD exchange rate is driven by the Hong Kong dollar’s de facto peg to the USD. Because the SGD is also influenced by USD dynamics, the SGD/HKD cross tends to move more slowly and predictably than SGD/CNY. Real-time rates can be found on XE’s SGD/HKD converter.
Best services for currency conversion
The same race to the mid-market applies. For SGD to HKD, digital services like Wise and Revolut offer narrow spreads, while physical money changers in Hong Kong’s Tsim Sha Tsui area often give competitive cash rates. The difference between a bank counter and a digital specialist on a S$5,000 transfer can be over S$100.
The pattern: wherever you are converting, the provider you choose matters more than the day’s market move.
Related reading: SGD to Chinese Yuan: Live Rate, Forecast & FAQs · Convert Ringgit to SGD: Current Rate & How To Convert
Frequently asked questions
What is the difference between the mid-market rate and the rate I get at a money changer?
The mid-market rate is the wholesale rate used by banks trading with each other. A money changer adds a spread — typically 1-3% — to cover their costs and profit. That spread is the price you pay for convenience and immediacy.
Does DBS offer a good rate for SGD to RMB?
DBS, as a retail bank, typically offers rates that include a margin of 1.5-3% over the mid-market. For large transfers, you can request a better rate, but for everyday conversions, digital specialists like Wise or a competitive money changer will usually beat a bank counter rate.
Is it better to use YouTrip or a physical money changer for RMB?
For amounts under S$2,000, YouTrip’s digital rate with no weekday fee (check current terms) is often cheaper. For cash above S$5,000, a good money changer in Singapore — like those at The Arcade — can negotiate a tighter spread. Always compare before committing.
How often does the SGD to RMB exchange rate change?
The mid-market rate changes continuously during market hours (Monday to Friday, Asian to New York sessions). The spread widens outside of core trading hours, so check a live rate from XE’s converter just before you transact.
What factors cause the biggest swings in the SGD/CNY pair?
PBoC announcement days (rate decisions, RRR changes) and MAS monetary policy statements cause the largest one-day moves. Also, any sudden change in US-China trade tensions or a sharp move in the USD/CNY fix can produce a 1-2% swing in the SGD/CNY cross within hours.
Can I use RMB in Singapore?
No, the Chinese yuan is not legal tender in Singapore. Some money changers and larger retailers near tourist areas may accept RMB, but the exchange rate offered will be poor. Always convert at a fair rate before arrival.
More related posts
 Cheapest 3-Room Resale Flat – Lowest Prices in Yishun
 Mitsubishi Aircon System 3: Price, Symbols, Problems & Settings
 Ah Yat Seafood Restaurant: Menu, Locations & Singapore Guide
 Best Photo Backup Solutions: The Free & Paid Picks
 Lawrence Wong Singapore Budget 2026: Full Breakdown
 Aircon Gas Top Up Price Ireland: 2025 Cost Breakdown
 Lee Joon-hyuk: Biography, Height, Marriage & Royal Ancestry